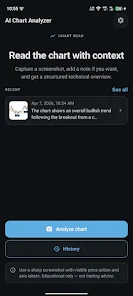

Chart AI: Stocks & Crypto TA brings an artificial-intelligence chart reader to your phone, helping traders and investors analyze stock, crypto and forex charts in seconds by scanning screenshots or uploaded images. The app recognizes candlestick, line and bar charts and highlights technical patterns and potential entry and exit zones so you can save time on manual chart study and focus on decision-making across global markets and exchanges. Designed for day traders, swing traders and long-term investors, Chart AI: Stocks & Crypto TA aims to surface head & shoulders, double tops and bottoms, flags and other commonly observed setups with clear visual cues.
Key features and visual style
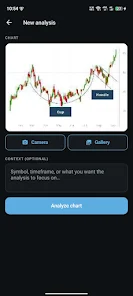
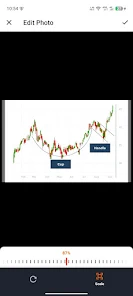
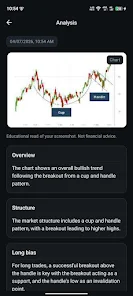
The interface centers on fast image-based analysis: load a screenshot or upload a chart image, crop to the area of interest and tap analyze. The app overlays detected patterns and marks likely entry and exit regions directly on the image, using color-coded lines and shaded zones to make signals easy to interpret at a glance. It supports multiple chart types, accepts charts from global exchanges, and offers compact result panels that summarize which patterns were detected, why they matter and what to watch next. The overall visual style is clean and information-focused, prioritizing legibility with adjustable font sizes and clear chart overlays so signals remain visible even on smaller screens.
How analysis works and controls
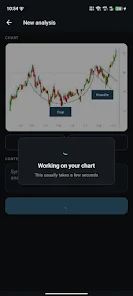
Analysis is image-driven: the built-in pattern recognition scans the plotted price action, identifies structural shapes and highlights key levels without requiring a linked trading account. Controls are straightforward and touch-friendly: use the upload button or a quick screenshot import, crop or zoom to refine the area to be analyzed, then run a scan. Results appear as annotated images plus a short textual explanation of detected setups. Users can toggle annotation layers on or off to focus on patterns, support/resistance lines, or suggested risk zones, and can re-run analyses at different zoom levels to check shorter or longer timeframes within the same picture.
User experience, progression and learning
The app is built to be useful for a wide range of skill levels. Beginners will appreciate concise, plain-language notes that accompany each analysis and identify the pattern type and common considerations traders use when interpreting it. More experienced users can rely on the rapid visual parsing to confirm hypotheses or to scan many charts quickly. As users analyze more charts their familiarity with recurring setups tends to grow, which supports a natural learning progression: start by recognizing simple patterns, then use repeated examples to build confidence in pattern interpretation and trade planning outside the app.
Customization, accessibility and offline considerations
Chart annotation preferences can be adjusted so you only display the pattern types and annotations you care about; choose between subtle overlays or high-contrast markers depending on your screen and lighting. The app aims to be accessible by providing larger text options and clear color contrasts for key indicators. Because the workflow is based on images, you can keep a library of saved screenshots and analyze them sequentially; note that some advanced server-side processing may require an internet connection, so saved-image analysis may be limited when completely offline.
Replay value, workflow integration and reliability
Replay value comes from repeated use as part of a study routine rather than from gamified progression. Traders can repeatedly analyze past charts to test pattern recognition consistency, catalog notable setups and refine their own checklist for follow-up research. The app is intended to complement, not replace, manual analysis: treat flagged patterns as starting points to verify with your preferred charting platform and risk-management rules. The processing focuses on visual accuracy and clarity rather than on live trading automation—there is no direct feed integration or connected order execution built into the current release.
Limitations, roadmap and best practices
Some advanced capabilities such as real-time push alerts, pattern history tracking and strategy backtesting are planned for future updates and are listed as coming soon. At present the app relies on uploaded images or screenshots and does not connect to live trading accounts, so users should combine its output with price data, volume analysis and their own trade planning. Use Chart AI: Stocks & Crypto TA as a rapid visual assistant and educational aid, verify signals with additional tools, and maintain sound risk management when translating pattern observations into trading decisions.